At Quadrant, we aim to bring transparency to the location data space. To do so, we have made public various metrics for data buyers to evaluate our mobile location data feeds.
Daily/Monthly Active Users
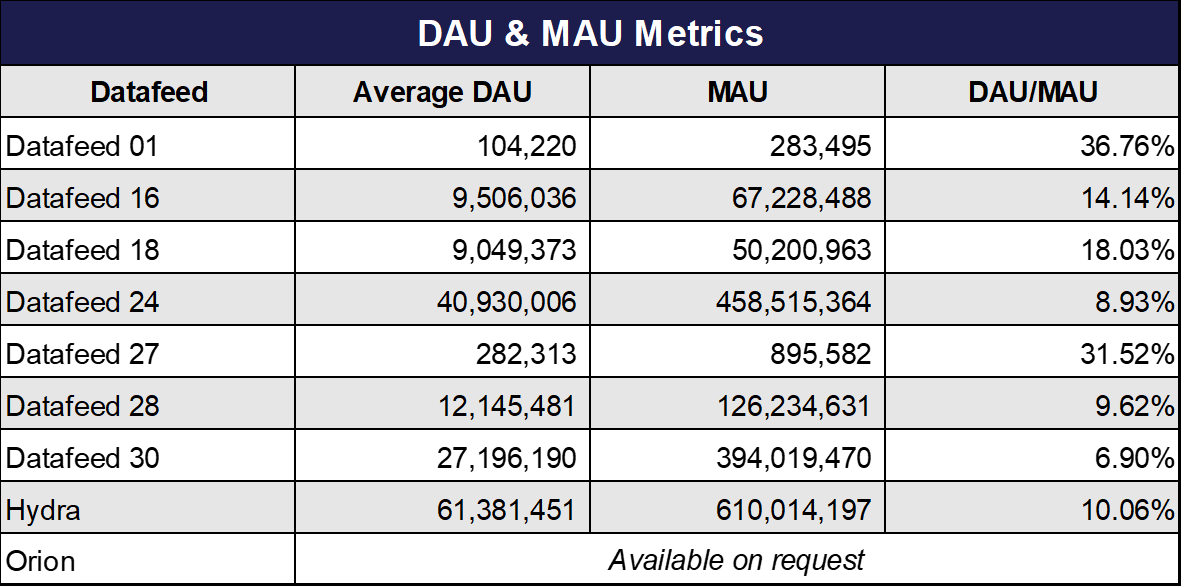
The activeness, consistency and scale of a panel can be approximated with the Average Daily Active Users (Average DAU), Monthly Active Users (MAU) and the DAU/MAU ratio.
Below is the Average DAU, MAU and the DAU to MAU ratio of Quadrant's location datafeed for the month of October:

A more detailed metric to evaluate the panel activeness and consistency of our mobile location data feed is the Days Seen Per Month metric.
View the metric on our dashboard, available in our platform here.
Events Per Device Per Day
Events per device per day is an industry standard metric to establish a minimum viable daily device activity, and is typically important for organisations involved in mobility analytics.
The table below shows the distribution of devices by the number of events for all our datafeeds:

Note that more location events does not neccessarily means better data, read more about it here.
Hours Seen Per Day
Hours seen per day shows the distribution of events by hours. It helps data buyers evaluate the intraday activeness and consistencyof the panel of devices in a location data feed.
The table below shows the distribution of events by hours seen per day for all of our datafeeds. You can find a more detailed breakdown in our platform.

Every location data feed has their unique characteristic, the suitability of a particular data feed for an organisation depends mostly on the needs of the business. Quadrant makes transparent these metrics to help data buyers select the right data feed for their business. To view the full suite of metrics and historical data, please visit our platform.
For organisations with more specific needs, Quadrant offers mobile location data that is filtered and processed based on your specific criteria.
For more information, contact us today.

