What is mobile location data?
Mobile location data is information that helps identify the geographic position of mobile devices such as smartphones and tablets. Location data is typically represented using latitude and longitude coordinates and may include additional attributes such as timestamp, horizontal accuracy, altitude, device identifiers, and geospatial indexes.
Businesses use mobile location data to understand movement patterns, analyze visitation behavior, improve location based services, build mapping products, support AI applications, and generate real world insights.
How is mobile location data collected?
Mobile location data can be collected from several sources, including GPS signals, mobile applications, Wi Fi signals, beacons, and other location technologies.
GPS remains one of the most accurate sources of location information, providing precise latitude and longitude coordinates under suitable conditions. Different collection methods offer different levels of accuracy, coverage, and scale, making it important to understand the source of the data before using it for analytics or AI applications.
What is GPS location data?
GPS location data refers to geographic coordinates generated by the Global Positioning System. GPS enabled devices communicate with satellites to calculate their location on Earth.
GPS data is widely regarded as the standard for location intelligence because it provides highly accurate positioning when satellite visibility is strong. However, accuracy may decrease indoors or in areas where buildings, terrain, or other obstacles interfere with satellite signals.
What is mobile location data used for?
Mobile location data supports a wide range of use cases, including:
- Mobility and movement analysis
- Retail site selection
- Trade area and catchment analysis
- Market intelligence
- Real estate analytics
- Transportation planning
- Mapping and navigation products
- Audience insights
- Location based services
- AI model training and evaluation
- Point of Interest enrichment
How is location data used in AI?
Location data is becoming an increasingly important component of AI systems that require an understanding of the physical world.
AI developers use location data to train, evaluate, and improve models that support mapping, navigation, mobility intelligence, geographic search, recommendation engines, logistics optimization, urban planning, and location based decision making.
When combined with Points of Interest data and geospatial context, location data helps AI systems understand where people go, how places are connected, and how movement patterns evolve over time.
Why is location data important for AI models?
Most AI models understand digital information such as text, images, and videos. Location data adds real world context by connecting people, places, and movement patterns.
This allows AI systems to:
- Understand spatial relationships between locations
- Improve geographic reasoning
- Build more accurate maps
- Generate location aware recommendations
- Analyze human mobility patterns
- Support geospatial search and discovery
Location data helps bridge the gap between digital intelligence and real world activity.
What makes location data AI ready?
AI ready location data is accurate, structured, privacy compliant, and enriched with metadata that helps machine learning systems interpret real world locations and movement.
Important characteristics include:
- High positional accuracy
- Quality controlled location events
- Historical coverage
- Global scale
- Privacy compliant collection
- Rich geospatial attributes
- Point of Interest enrichment
- Consistent data formatting
High quality data improves model performance, reduces noise, and enables more reliable AI outcomes.
Is it legal to use mobile location data?
Yes, anonymized mobile location data can be used legally when it is collected and processed in accordance with applicable privacy regulations and user consent requirements.
Data privacy regulations such as GDPR, CCPA, and other regional privacy frameworks require organizations to obtain appropriate consent and provide transparency regarding how data is collected, processed, stored, and shared.
Responsible location data providers implement privacy safeguards and data governance practices to support regulatory compliance.
What is visitation data?
Visitation data measures when devices are observed at specific locations or Points of Interest.
Businesses use visitation data to understand customer traffic patterns, analyze venue performance, benchmark competitors, and measure real world engagement.
What is mobility intelligence?
Mobility intelligence refers to insights derived from aggregated location data that help organizations understand movement patterns, travel behavior, visitation trends, and geographic relationships between places.
Mobility intelligence is widely used in retail, real estate, transportation, finance, government, and AI applications.
How do you ensure location data quality?
High quality location data requires rigorous validation and quality control processes.
Common quality assurance methods include:
- Noise filtering
- Fraud detection
- Signal validation
- Duplicate removal
- Accuracy verification
- Device quality scoring
- Temporal consistency checks
- Point of Interest validation
These processes help ensure reliable analytics and AI outcomes.
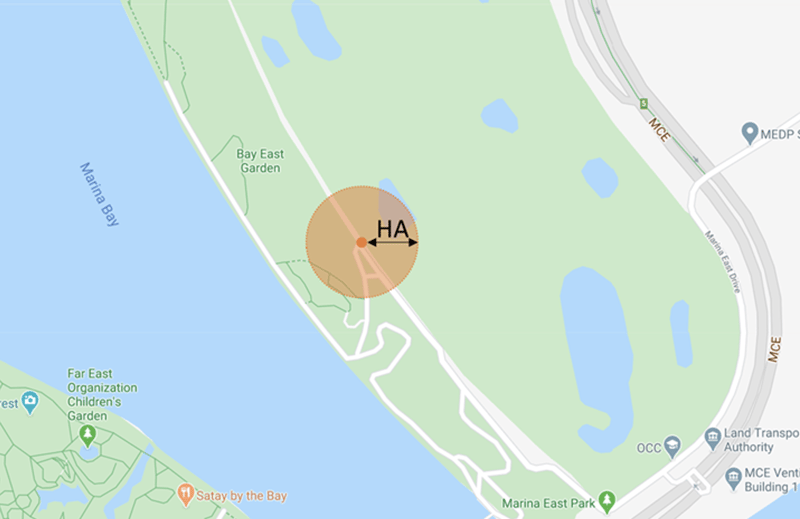
What is horizontal accuracy?
Horizontal accuracy represents the estimated distance between a recorded location point and the device's true location.
It is typically expressed as a radius around a coordinate. A smaller horizontal accuracy value generally indicates a more reliable location observation.
Understanding horizontal accuracy is critical when performing venue level analysis, visitation measurement, and geospatial modeling.
What is geofencing?
Geofencing is the creation of a virtual geographic boundary around a physical location or area.
Organizations use geofences to analyze visitation behavior, measure foot traffic, define catchment areas, study movement patterns, and evaluate location performance.
Geofencing is commonly used in retail analytics, market research, transportation, and mobility intelligence.
What is a geohash?
A geohash is a geospatial indexing system that converts latitude and longitude coordinates into an alphanumeric string.
Geohashes help organize and query large location datasets efficiently, making them widely used in geospatial analytics, mobility intelligence, AI workflows, and location based applications.
What location data fields are commonly included?
Mobile location datasets may include:
- Latitude
- Longitude
- Timestamp
- Horizontal accuracy
- Altitude
- Geohash
- Country and region information
- Device identifiers
- Point of Interest associations
Available fields may vary depending on the data source and use case.
What is teleportation in location data?
Teleportation refers to location events that indicate a device has moved between two places faster than physically possible.
For example, if a device appears in New York and then appears in Los Angeles a few minutes later, the movement is unlikely to represent real world behavior. This is commonly referred to as a teleportation event.
Teleportation can occur for several reasons, including:
- GPS signal errors
- Device location spoofing
- Data collection issues
- Low quality location signals
- Incorrect timestamping
- Data aggregation errors
It is important to note that a small percentage of teleporting events is normal and expected in virtually all large scale location datasets. GPS signals can be affected by environmental conditions, device hardware limitations, network behavior, and other factors that occasionally result in inaccurate location observations.
The presence of some teleportation does not necessarily indicate poor quality data. What matters is how effectively a provider identifies, measures, and filters anomalous events before delivering data to customers.
Because teleportation events can distort mobility analysis and AI training datasets, high quality location data providers apply quality control processes to identify and remove impossible movements. Many providers use speed thresholds, trajectory analysis, and machine learning techniques to detect and filter suspicious signals while preserving legitimate movement patterns.
How does Quadrant remove fraudulent and low quality location signals?
Quadrant applies rigorous quality control processes, including noise filtering, deduplication, accuracy validation, and teleportation detection to identify and remove anomalous location events. These measures help improve the reliability of mobility analytics, visitation measurement, location intelligence, and AI applications built on location data.
What are one time ping devices in location data?
One time ping devices are devices that generate only a single location event, or very few location events, within a given time period.
For example, a device may appear once in a dataset with a single GPS observation and then never appear again. These devices are commonly referred to as one time pingers, single ping devices, or low frequency devices.
One time ping devices are a natural part of most large scale location datasets and can occur for several reasons:
- Users uninstall an app
- Users revoke location permissions
- Infrequent app usage
- Temporary data collection interruptions
- Device replacement or resets
- Limited participation in the underlying data network
Some one time ping devices represent legitimate users and are a normal, expected part of any large scale location dataset. Users may only open an app occasionally, revoke location permissions, replace their devices, or simply generate very few location signals over a given period. While a certain percentage of one time ping devices is completely natural, these devices generally provide limited analytical value because there is insufficient data to understand movement patterns, visitation behavior, dwell time, or device trajectories over time. For this reason, many location intelligence providers apply device quality and activity thresholds when generating mobility insights, visitation metrics, and AI training datasets.
For this reason, many location intelligence providers apply minimum activity thresholds and quality filters when generating mobility insights, audience segments, visitation metrics, and AI training datasets.
What are best practices for evaluating location data?
Evaluating location data requires more than simply looking at the volume of records. High quality location intelligence depends on the accuracy, consistency, and reliability of the underlying signals.
Key factors to consider include:
- Geographic Coverage: Does the data cover the markets relevant to your business?
- Accuracy: What is the typical horizontal accuracy of location observations?
- Device Quality: How are low quality devices and anomalous signals identified and filtered?
- Freshness: How quickly is new data made available?
- Consent and Privacy Compliance: Is the data collected and processed in accordance with applicable privacy regulations?
- Historical Depth: How much historical data is available for analysis and model training?
- Teleportation Rates: How effectively are impossible movements identified and removed?
- One Time Ping Devices: What percentage of devices generate only a single observation?
- Data Consistency: Are location signals stable and reliable over time?
- Scalability: Can the dataset support large scale analytics and AI applications?
Organizations should also request sample data and validate it against their own use cases. A location dataset that performs well for market level analysis may not be suitable for venue level visitation measurement, mobility intelligence, or geospatial AI applications.
The most valuable location data is not necessarily the largest dataset, but the one that delivers the highest quality signals, reliable coverage, and actionable insights.
How Should One Evaluate a Location Data Provider?
Evaluating a location data provider requires understanding both the scale and quality of the underlying data. Large datasets are valuable only if the signals are accurate, reliable, and suitable for your intended use case.
Key factors to consider include:
- Geographic Coverage: Does the data cover the countries and regions important to your business?
- Data Accuracy: What is the typical horizontal accuracy of location observations?
- Data Freshness: How quickly is new data delivered and updated?
- Historical Coverage: How much historical data is available for analysis and AI training?
- Device Quality: How are low quality devices and anomalous signals identified and filtered?
- Teleportation Detection: How are impossible movements detected and removed from the dataset?
- One Time Ping Devices: What percentage of devices generate only a single observation, and how are they handled?
- Privacy Compliance: Is the data collected with appropriate consent and in accordance with applicable privacy regulations?
- Data Consistency: Are signals reliable across different markets and time periods?
- Support for Analytics and AI: Is the data suitable for mobility intelligence, visitation measurement, geospatial analytics, and AI applications?
Organizations should always test sample data against their specific use cases before selecting a provider. The most valuable location data is not necessarily the largest dataset, but the one that delivers the most reliable, accurate, and actionable insights.
Basics of Location Data
Location data are information about the geographic positions of devices (such as smartphones or tablets) or structures (such as buildings, attractions).
The geographic positions of location data are called coordinates, and they are commonly expressed in Latitude and Longitude format.
Additional attributes such as elevation or altitude may be included and helps data users get more accurate picture of the geographic positions of their data.
People commonly mean GPS data when they talk about location data. In reality, there are various types of location data.
It is important to know how the data is collected as it determines the accuracy and depth of the collected data, this have direct implications on the suitability and usability of the data for a business.
Representing Location Data
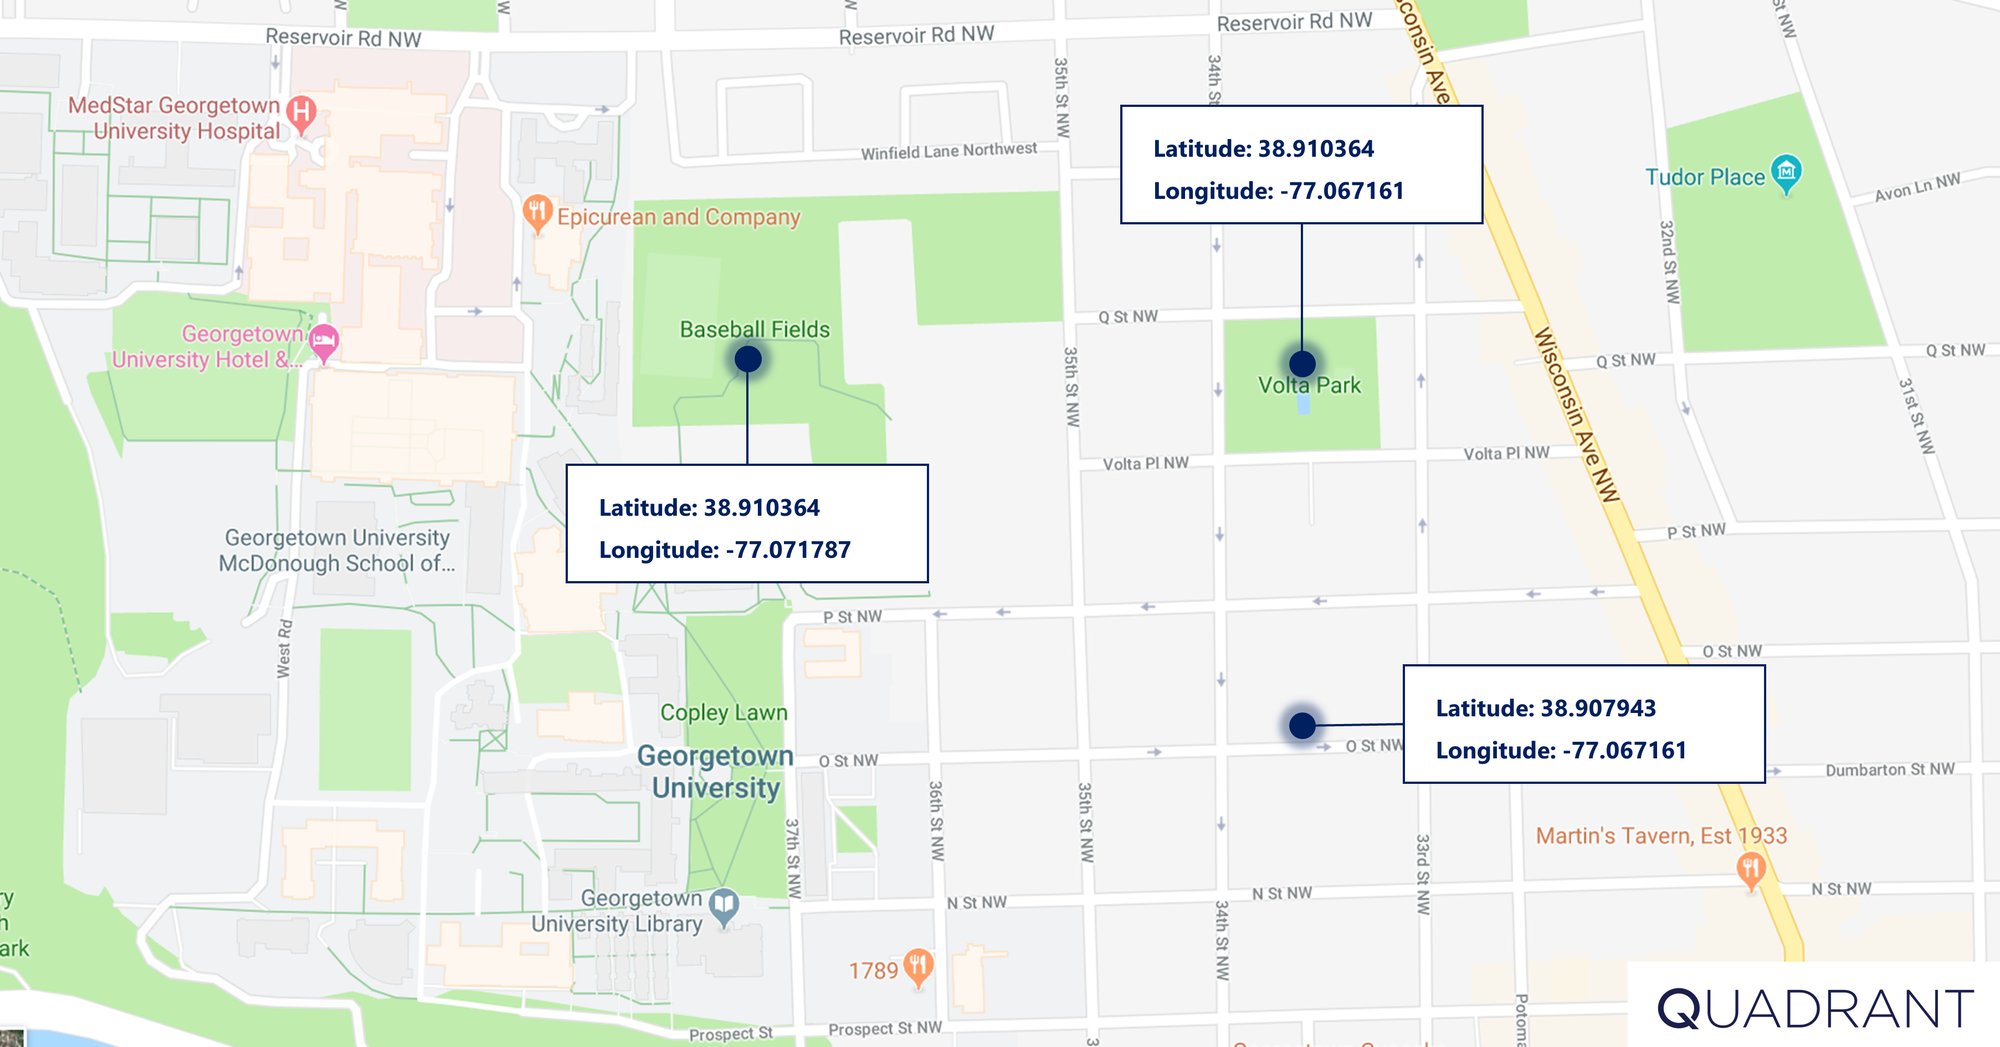
Latitude / Longitude
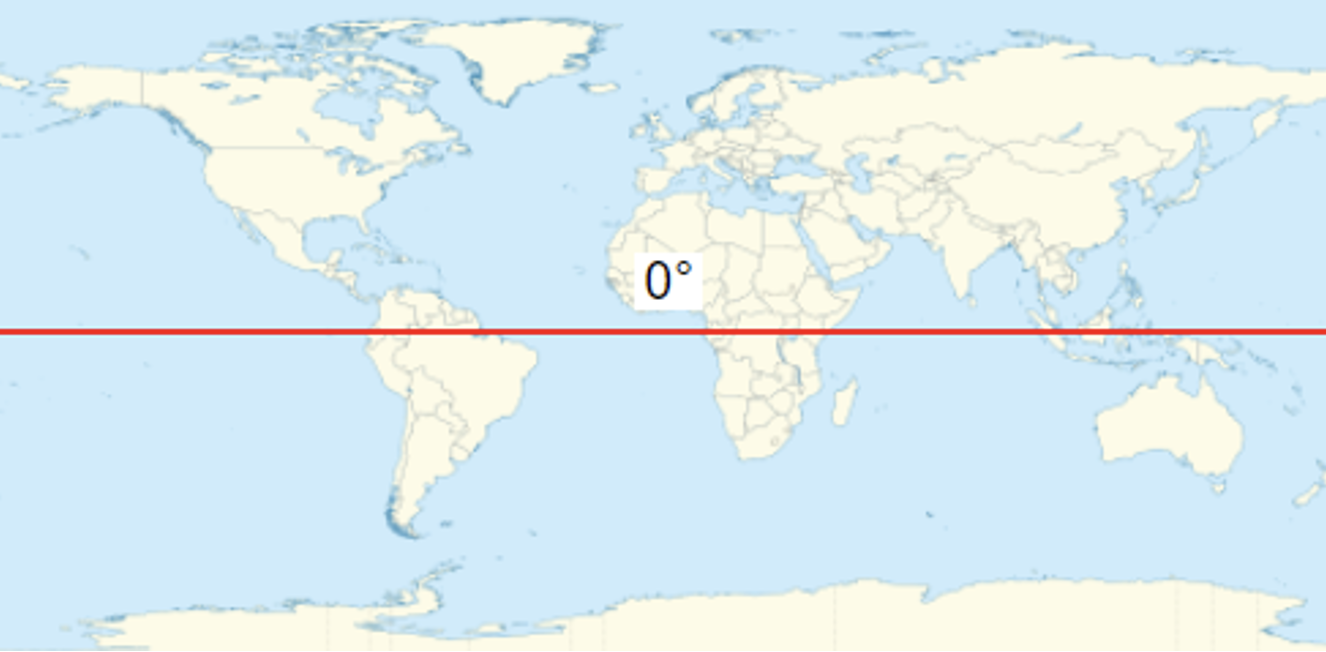
The "latitude" of a point on Earth's surface is the angle between the equatorial plane and the straight line that passes through that point and through (or close to) the center of the Earth. The 0° parallel of latitude is designated the Equator, the fundamental plane of all geographic coordinate systems.
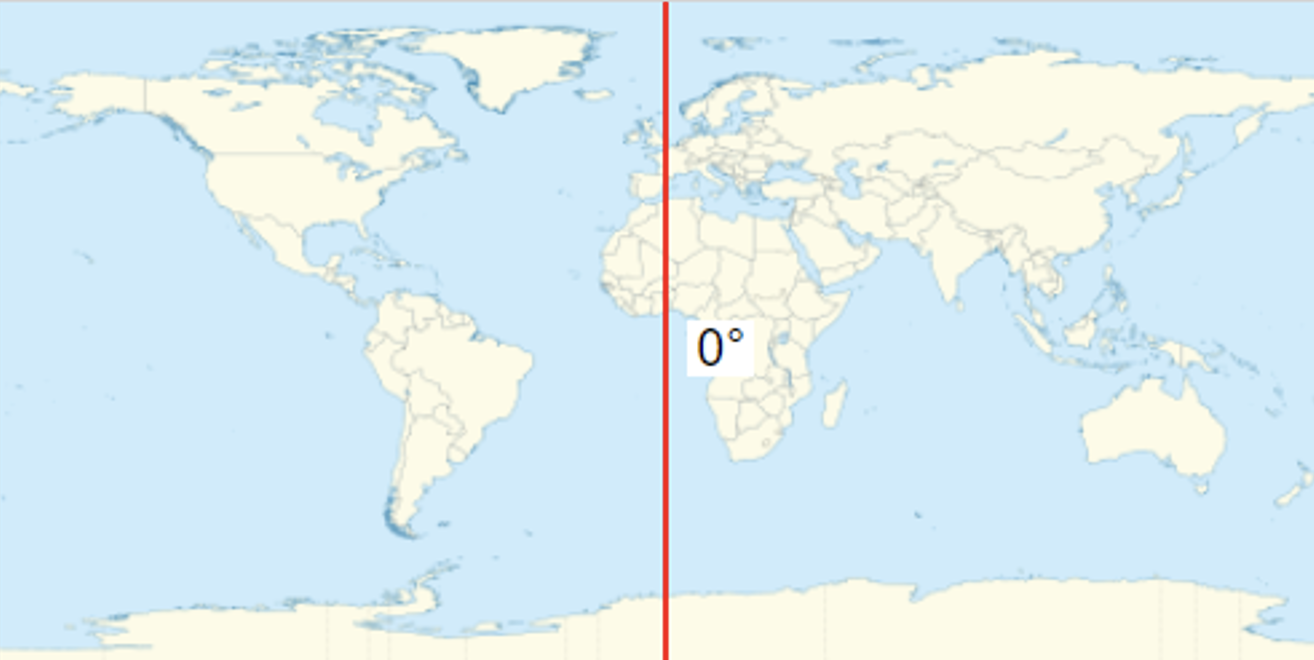
The "longitude" of a point on Earth's surface is the angle east or west of a reference meridian to another meridian that passes through that point. Fun fact, you can actually step on the meridian if you ever visit British Royal Observatory in Greenwich, in southeast London (highly recommend it as the view of the city is amazing from there).

The combination of these two components specifies the position of any location on the surface of Earth. Lat/long data points can be expressed in decimal degrees (DD). The other convention for expressing lat/long is in degrees, minutes, seconds (DMS). For example, below is the same point expressed in DD and DMS (you can find many converters online):
DD: 47.21746, -1.5476425
DMS: 47° 13’ 2.856”, 1° 32’ 51.5106”

You can see these DMS coordinates at airports, where the gates are marked in degrees, minutes and seconds
Another important thing to understand about decimal degrees is that they carry a level of precision. The number of decimal places required for a particular precision at the equator is:
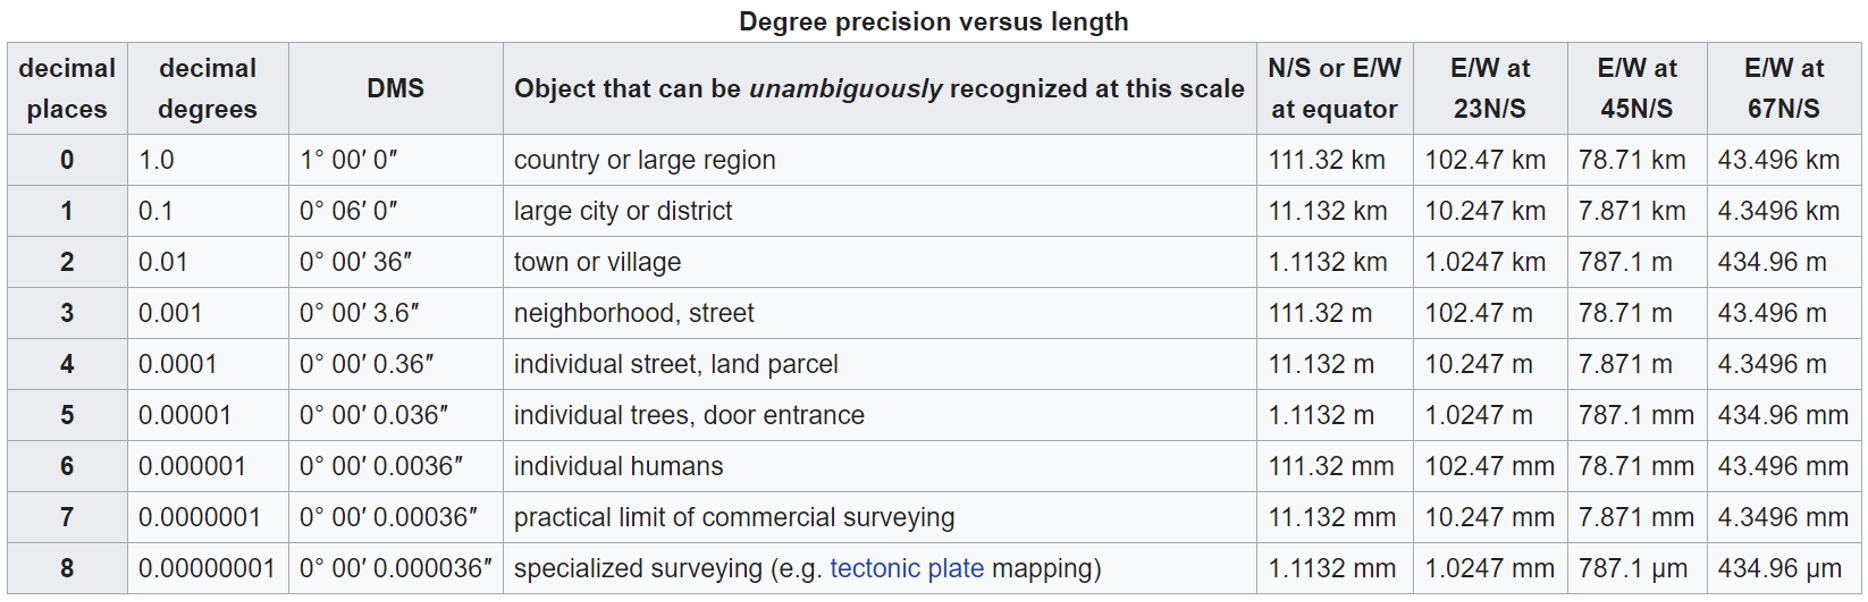
A value in decimal degrees to a precision of 4 decimal places is precise to 11.132 meters at the equator. A value in decimal degrees to 5 decimal places is precise to 1.1132 meter at the Equator.
Geohash
Invented by Gustavo Niemeyer, Geohash is a geocoding system that allows the expression of a location anywhere in the world using an alphanumeric string. Geohash is a unique string derived by encoding and reducing the two-dimensional geographic coordinates (latitude and longitude) into a string of digits and letters. A Geohash can be as vague or accurate as needed depending on the length of the string.
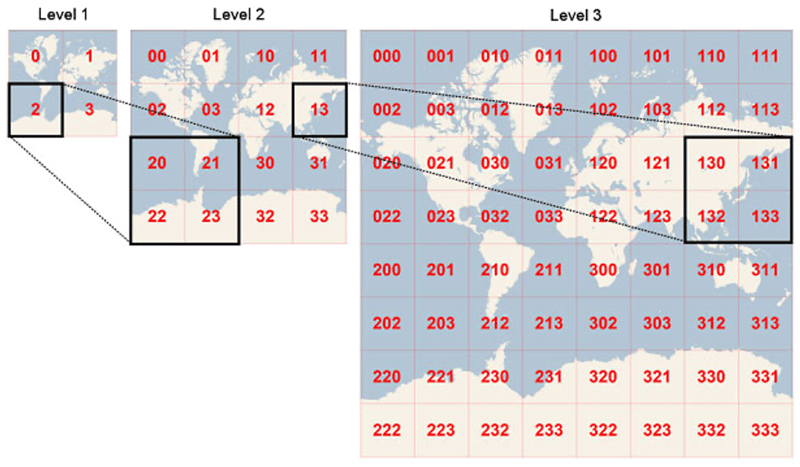
Geohashes use Base-32 alphabet encoding i.e., uses all digits 0-9 and almost all lower-case letters except "a", "i", "l" and "o". It is a convenient way to express a location anywhere in the world. Geohashes basically divide the world into a grid with 32 cells. Each cell will also contain 32 cells, and each one of these will contain 32 cells (and so on repeatedly).
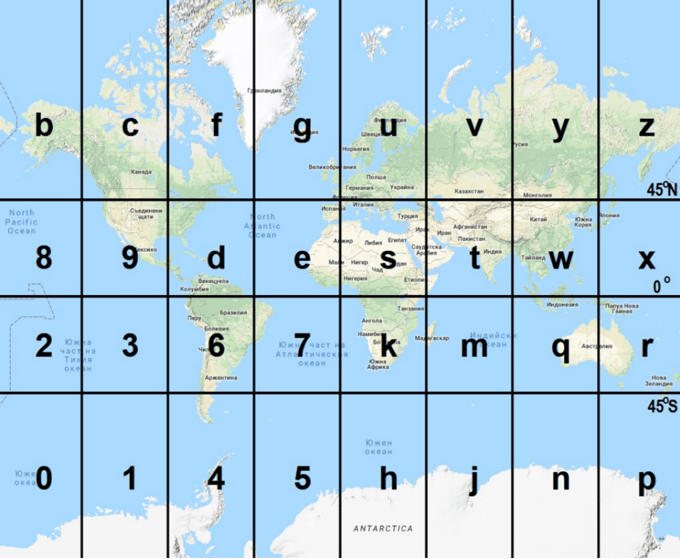
Adding characters to the geohash sub-divides a cell, effectively zooming in to a more detailed area. This is referred to as geohash precision. Geohash Precision is a number between 1 and 12 that specifies the precision (i.e., number of characters) of the geohash. Each additional character of the geohash adds precision to your location.
At Quadrant, we usually provide 12-precision geohash for all the events.
The cell sizes of geohashes of different lengths are as follows; note that the cell width reduces moving away from the equator (to 0 at the poles):
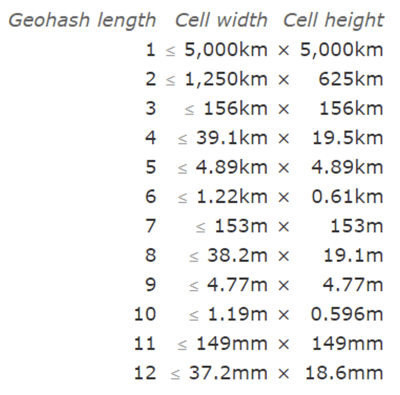
Visually:
Geohashes have a certain property that makes them suitable for geospatial queries like localized search (points with similar geohashes that are near each other with the same geohash prefixes).
For example, if you want to list the number of persons who were seen in and around the Empire State Building, you can first determine the geohashes you want to cover and then run a simple query:
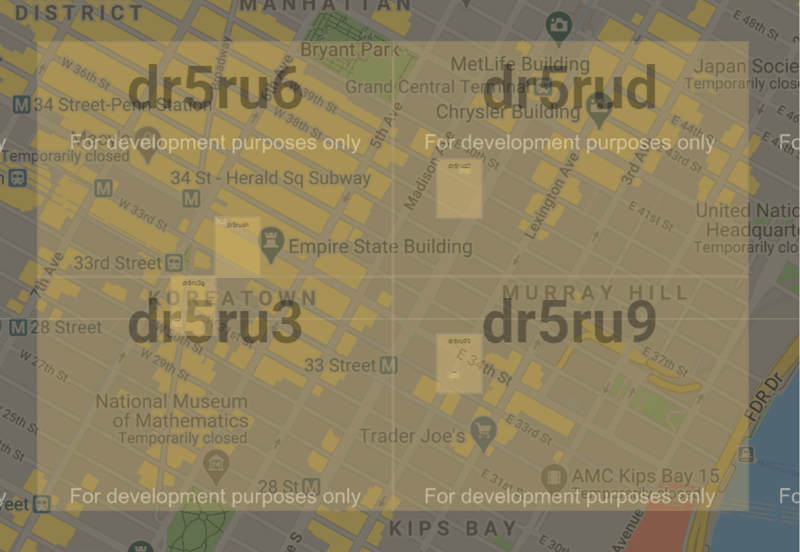
SELECT * FROM table_name WHERE geohash like 'dr5ru6%' or geohash like 'dr5ru3%' or geohash like 'dr5rud%' or geohash like 'dr5ru9%';
Doing this improves processing times and costs, as it allows you to quick sort through large amounts of data and work on more precise subsets of data. In fact, most data scientists use geohash to quickly sort through large location data sets, and then build specific queries (such as polygons) around the specific point/area of interest. In doing so, you can reduce your costs and increase your speed of processing, while maintaining accuracy and precision.
Types of geo-indexing systems
Geodata is information about geographic locations that is stored in a format that can be used with a geographic information system (GIS). For example, at Quadrant, our geo data is stored in three different formats which can be used for geospatial analysis: Country Codes, Latitude & Longitude coordinates, and Geohashes.
Country Codes
Usually the ISO2 2-digit alpha country code represents the locale of the devices i.e. the devices registered to users from the stipulated countries. At Quadrant, in addition to the country code, we also derive another attribute called ‘country’, where the country represents the events / devices that are seen within the geographical boundaries of stipulated countries. For example, if you want to get the total number of events seen within Singapore by using its country code, you can run a simple query: SELECT count(*) FROM table_name WHERE country = ‘SG’;
Lat/long coordinates
Coordinates can be used to identify where an event was recorded. We can use the coordinates to either list devices from a single location: SELECT * FROM table_name WHERE latitude = ‘41.9022’ and longitude = ‘-76.37695’
Or we can use a bounding box, which is an area defined by two longitudes and two latitudes, to get information from a certain area or a country.
Bounding box for Australia:
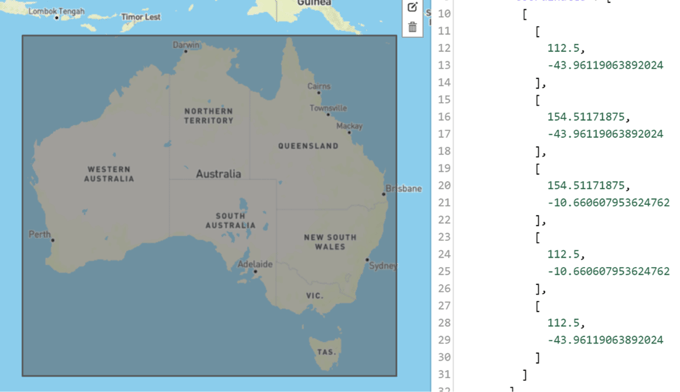
To get the total number of events seen within Australia by using a bounding box, you can run a simple query:
SELECT count(*) FROM table_name WHERE (latitude BETWEEN -43.96119063892024 and -10.660607953624762 and longitude BETWEEN 112.5 and 154.51171875);
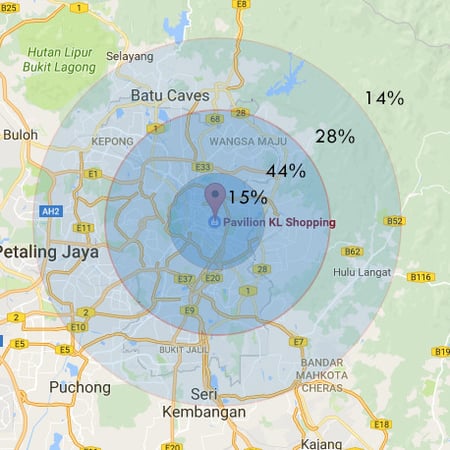
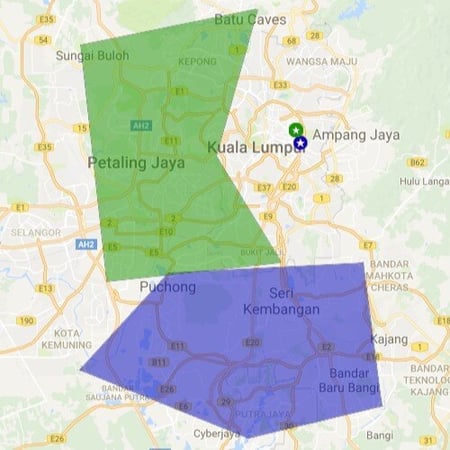
Geofencing
A geo-fence is a virtual perimeter for a real-world geographic area. They could be a radius around a single point, or a predefined set of boundary. Once a geo-fenced boundary is defined, the opportunities what businesses can do is limited by only their creativity.
One common use of geo-fencing is for businesses to set up geo-fences around their competitors. And push marketing promotions to customers that enters the zone. This is sometimes referred to as geo-conquest. Businesses could also provide Location Based Services within geo-fenced region.
Geofencing is ideal for catchment area analysis; a catchment is an area from which businesses expects to draw their customers from. Catchment areas can help businesses identify where to run their next marketing campaign or set up their next store.