Companies in the location data industry like to highlight the numerous uses and benefits of their data. However, the topic of how to select a data vendor remains largely undiscussed. As the old adage goes, ‘garbage in, garbage out’: low quality data leads to unsubstantiated, weak insights, and ultimately to wrong decisions. To ensure that the data you acquire helps you solve your business challenges, you need to evaluate data quality.
In this article, we introduce seven factors to consider when evaluating a location data vendor.
Learn about the vendor’s data sources
Location data comes from various sources, including cell-tower triangulation, mobile apps, Bidstream, and indoor positioning systems such as Wi-Fi or beacons. As a buyer, you must enquire about where the data is coming from and assess its suitability for analysis and your specific use case.
All the aforementioned sources represent varying levels of accuracy and adequacy. For example, data collected from first party mobile devices are often very accurate and insightful but lack scale. These apps have to be installed on hundreds of thousands or millions of devices to support large scale analyses. On the other hand, Bidstream data (collected from the ad servers when ads are served on mobile apps and websites) is easy to obtain at scale but lacks precision and can be quite unreliable. Beacons and Wi-Fi networks are also reliable sources for small scale analyses but can be limiting in terms of coverage.
.jpg?width=900&name=Location%20data%20collection%20(Insider).jpg)
Assess the DAU vs MAU ratio
This ratio of Daily Average Users (DAU) and Monthly Average Users (MAU) is useful when you are analysing a month’s worth of data and want to understand the right sample for your specific use case. The DAU: MAU Ratio, from 0 to 100%, reflects the consistency of the devices in the vendor’s data feed. A ratio closer to 100% suggests that the devices in the dataset are seen more days in the month and shows a good level of engagement with most users being seen daily. This simple ratio can be derived by dividing the number of DAU by the number of MAU.

Check data for completeness and consistency
For location data analysis, data completeness and consistency are foundational. Completeness refers to the availability of all relevant and desired fields that are necessary for your analysis. Consistency is defined as the persistent availability of those fields in datasets delivered over a period of time. The best practice is to ensure that your data supply has a completeness per attribute as close as possible to 100%. Defining and ordering these attributes by importance to your use case will allow you to rank different supplies of data. Data consistency is also a major concern especially when your potential vendor is aggregating data from multiple sources. To check the uniformity of data, you can compare historic and current datasets, across variables and over time. Ask questions about how the data vendor is combining and normalising data to create a unified, reliable stream of data, which leads us to our next best practice.
Understand the vendor’s data quality assurance process
It is important to understand how your vendor identifies and removes noise from the data. Filtering noise from location data helps achieve a high degree of precision. In location data, attributes such as device ID, latitude, longitude, horizontal accuracy, and IP address are all important. If any of these fields contain invalid or unrealistic data, the entire row becomes worthless. Similarly, combining data from multiple sources requires data cleaning, normalisation, and deduplication for consistency. Without proper data quality assessment, preparing the raw data for your analysis can be time-consuming.
Ask questions about compliance
Location data is free of context, i.e., it doesn’t record a person’s identity, demographics, or any other personally identifiable information. However, data privacy laws still require that businesses obtain user consent for collecting and using location data. Most data providers do not take compliance into account, unless directly faced with non-compliance liabilities. Ask your data vendor about how they manage user consent and if they are prepared to provide a legitimate trail of data acquisition, should it be required for compliance or even internal audits. Holding the data provider accountable for compliance can save you time and money and protect you from reputation damage.
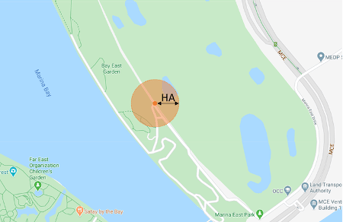
Define and determine horizontal accuracy
GPS data can be somewhat inaccurate, depending on the device. If you imagine a circle around a two-dimensional point, the term “horizontal accuracy” is the radius, expressed in meters. Depending on the use case, weak horizontal accuracy can immediately disqualify a data set. For example, retail analysis on small venues such as restaurants and shops requires precision. On the other hand, mobility analysis on the scale of a city can be done accurately, even if the horizontal accuracy is weak. In the example below, the exact location of the device will be anywhere within the orange shaded circle.
Gauge data granularity: Events per device per day
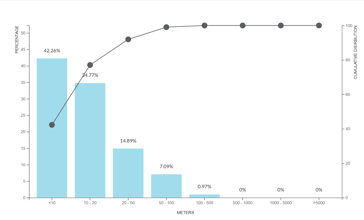
A useful metric often used for data evaluation is events per device. This shows how many events are logged per device in a given period of time (day, week, month etc.). Most often, events per device per day are used to gauge the density of the data within one given day.
Most companies use this metric as a measure of depth, as more events per device provide more information on users' movements and habits. Due to diverse types of data sources, user habits, SDK and device-specific settings, the distribution of events per device per day may be irregular over time. For example, it is possible that events could be highly concentrated within a short window. The following chart illustrates this point visually.

Gauge data granularity: Days seen per month and hours seen per day
Two additional metrics of interest are “days seen per month” and “hours seen per day”. These introduce a temporal element to the distribution of events. Days seen per month is defined as the number of devices seen on X number of distinct days per month. Hours seen per day is defined as the number of devices seen in X number of distinct hours per day.


With location data every industry has their unique use cases and applications. As a data buyer you must work with vendors who understand your needs, instead of going after a one-size fits all solution. A thorough vetting of your data provider’s processes can save you from buyer’s remorse. Defining your challenges and asking the right questions can get you one step closer to a fruitful analysis and better business decisions. To learn more about mobile location data visit our knowledge base. If you want to purchase location data for your company, please fill out the form below and one of our data experts will get back to you.