Location intelligence has revolutionised the way companies establish, operate and expand their business. From deciding an optimal location for a new store to performing footfall analysis to gauge competition in an area - location intelligence helps companies make faster, well-informed and profitable decisions.
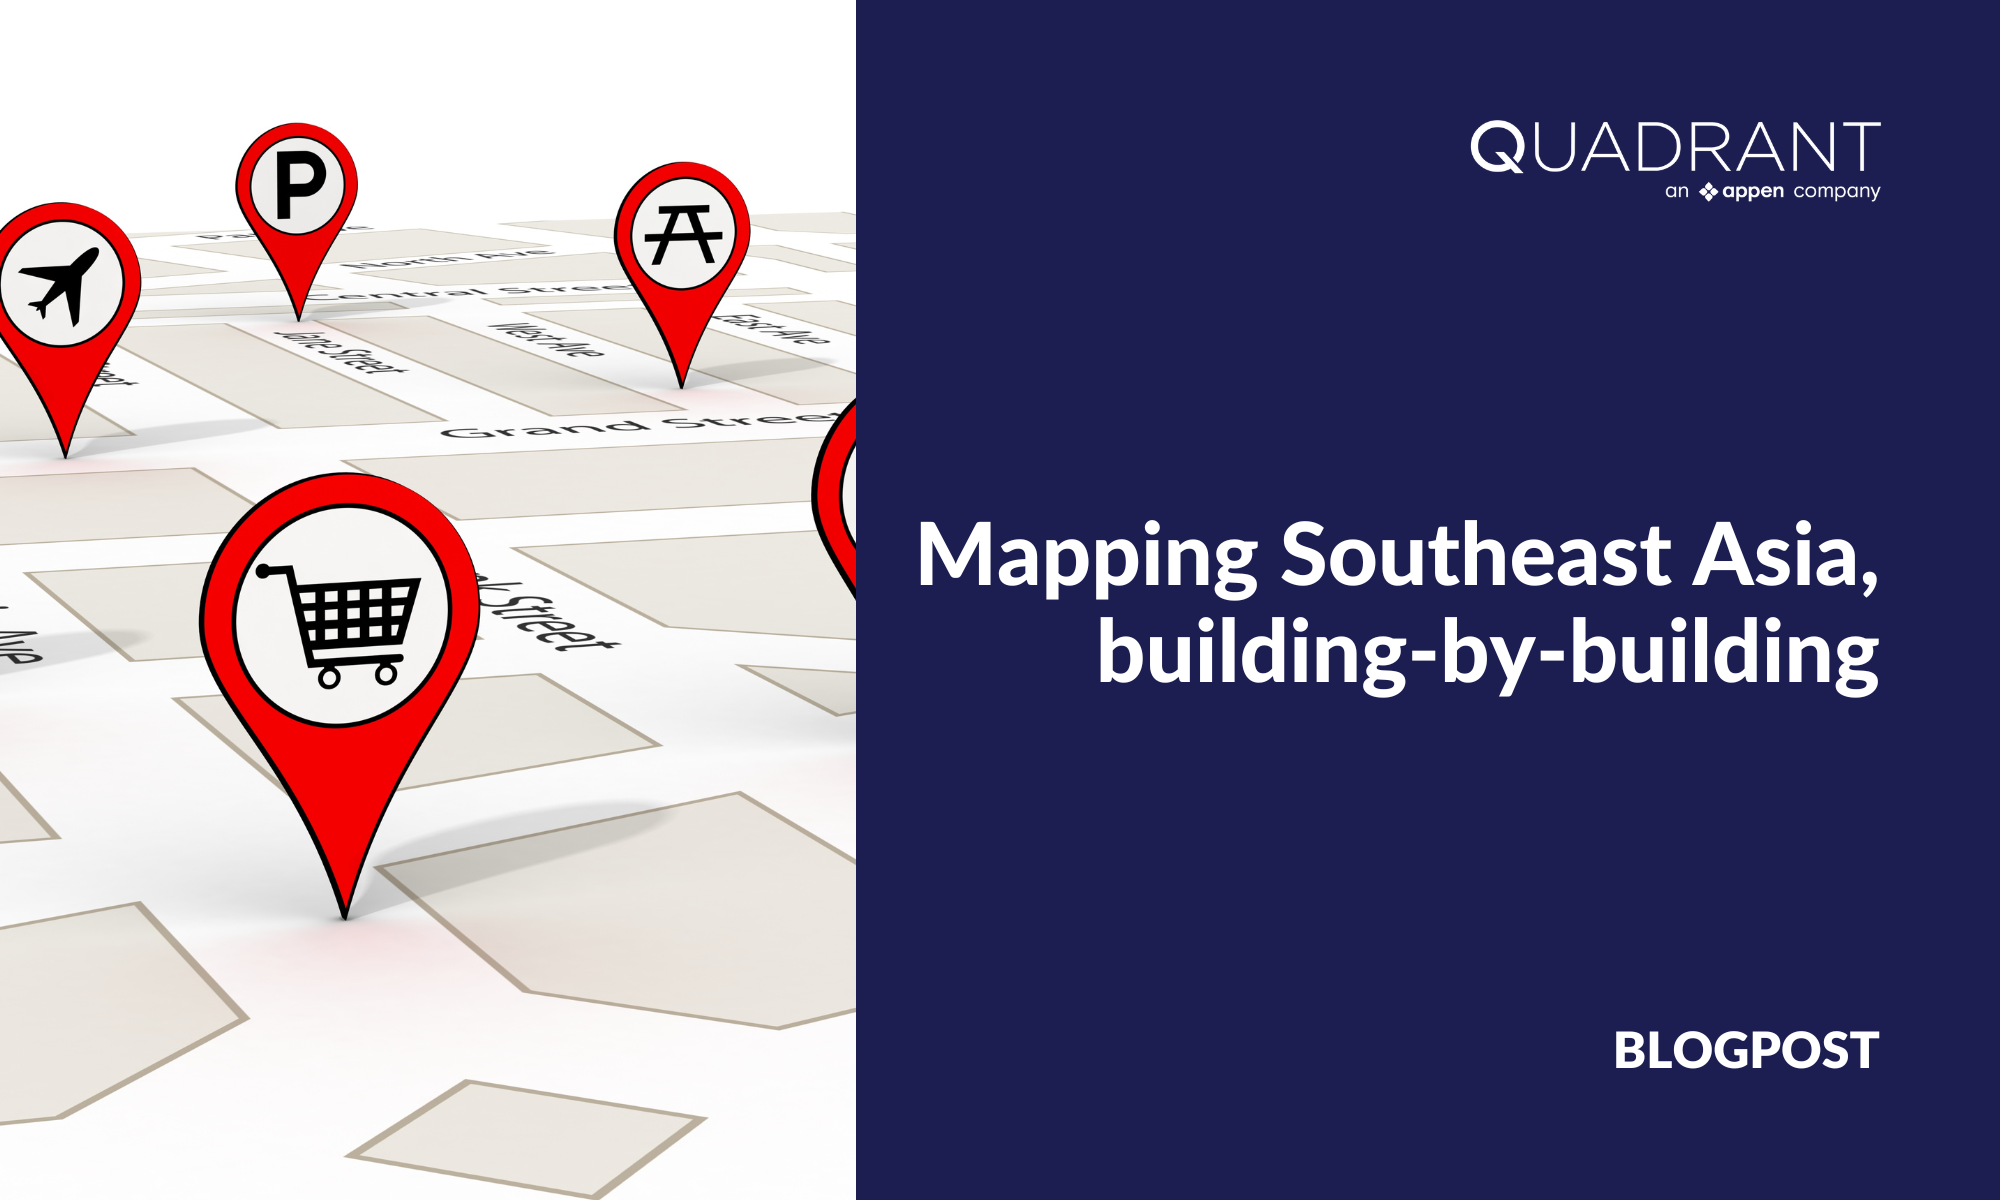
One of the critical components of location intelligence is Point-of-Interest (POI) data. A POI indicates a specific location in an area of interest for a business. It could be a retail store, a hospital, a university, or a commercial building depending on what intel you need. POI data is vital to maximising returns on marketing and advertising, expanding a business to new areas, powering maps and navigation systems for logistics and supply chain and more.
To adequately leverage POI data, buyers must understand the type of data they need, the scale they need it at, and understand the best way to represent the acquired data to fit their use case. Here are the various ways to represent POI data, and how these methods can help answer questions to specific use cases and applications.
How are POI data represented?
POI data, in general, are represented in the following two ways:
Point-based POI
Point-based POIs are represented using only a pair or latitude or longitude. This does not include any information about the area covered by the POI. It just indicates the pin point that represents the location.
E.g., The Marina Bay Sands can be represented by 1.2849088679212513, 103.86094436454383.

Although the point-based POIs carry only the location and do not provide any additional information related to the area, combined with mobile location data, they can be used in multiple location-based analyses. Some of the questions that can be answered with point-based POIs are:
• How many people are in the radial vicinity from a POI?
• Who are the people that are more likely to visit a store?
• What is the nearest POI within 200 meters from me?
Polygon-based POI
Polygon-based POIs carry certain advantages over point-based POIs. They are usually represented in a polygon shape format and you can derive the area covered by the POI.
The IKEA in Alam Sutera in Indonesia could be represented by a polygon:
((106.62694931030273 -6.200970813156756,
106.62866592407227 -6.244486550758661,
106.70127868652344 -6.241073682092138,
106.69767379760742 -6.188854026387887,
106.62694931030273 -6.191584594157971,
106.62694931030273 -6.200970813156756))

Polygon-based POIs can help us to answers some of the questions:
• How many people are inside a store?
• How many people are seen in a state/region/country?
• Who are the people that visited the store? (Note that polygon-based POIs can give an accurate result on devices inside a POI)
• What is the average time spent by the customers inside a store?
Although polygon-based POIs can provide more accurate info, polygon-related operations carry more complexity than point-related ones. A general rule of thumb is - the more sides in a polygon, the more complex the operation will be.
POI use case - Geofencing
POI in general are used individually to understand some of the following:
• Area they cover
• Potential reachability of the customers
E.g., let us take the Plaza Singapura shopping mall as a POI and see how much area it can cover within 500 meters to understand potential customer reachability:

POI combined with mobile location data can be used to solve multiple problems, geofencing being a great example. Geofencing can be done with either point-based or polygon-based POIs.
Consider the case of IKEA in Alam Sutera. We can use a point-based POI to create a 500 meter radial geofence to understand people who are most likely to visit the store. Below is an example using a polygon geofence combined with location data to show how the activity in and around IKEA looks like

The yellow polygon is the IKEA store. The above image shows the people who have visited the store (the devices inside the polygon) during the working hours (between 9 AM and 9 PM) on 13th of August, 2020.
This time-based visualisation can help us to exactly filter out people who have visited the store and derive further behavioural insights. E.g., once you filter the visitors of IKEA, you can understand more about them like:
• Where they have been before or where are they coming from
• Where they will go after visiting the store.
• What is the average dwell time of customers in the store
These insights can support the business in making right decisions, and all these insights depend on the quality and accuracy of POI data.
Quadrant maintains a manually verified, therefore authentic, accurate, and up-to-date POI database and is dedicated to delivering high-quality data sets that are ready to use. Combined with our expertise in location data solutions, we aim to be a holistic data partner for our customers.


