Earlier this year, we launched the public beta test of our proprietary POI collection and verification app, Geolancer. Aimed at providing up-to-date and manually-verified POI datasets, Geolancer is already helping ride sharing and real estate companies enrich their platforms with a hyper-accurate POI data feed. In this article, we provide a peek behind the curtain and explain how we maintain the high quality of POI data in Geolancer.

One of the focus areas during the real-world rollout of Geolancer has been data quality. In particular, we wanted to identify user patterns that can negatively impact the quality of POI data collected.
To recap, freelancers (Geolancers) equipped with the Geolancer app on their phones roam around the city, mapping places of value such as restaurants, retail, residential estates, historical monuments, etc. They are rewarded in cryptocurrency for every POI they add or verify.
Quadrant Quarterly Hackathons
At the end of every quarter, we organise company-wide hackathons where we encourage teams to come up with ideas and take them from concept to MVP in two days. Teams are created across different departments to encourage holistic approaches.
In our most recent hackathon, organised and led by Idris, VP of Product, the winning team worked on user behaviour analysis in Geolancer. We chatted with a member of the team and the man behind Geolancer operations, Torsten, to find out why this solution is so important and how it provides enormous value for data buyers.
Solving a real-world problem
Geolancer's goal is to provide accurate, authentic, and up-to-date POI data. Maintaining consistent data quality with freelancers however, can be challenging.
We were noticing a few typical and suspicious patterns in user behaviour during the beta launch campaign. For example, two POIs submitted by one Geolancer within the hour in two very different parts of the city. Our local community managers, who are familiar with the area, pointed out that unless the Geolancer was taking a jetpack, they couldn’t possibly travel that fast. We also saw some Geolancers barely moving, yet adding dozens of POIs.
It is important to note that these patterns do not necessarily point to fraudulent behaviour. A "flying Geolancer", for instance, might be two people using the same account on two devices kilometers apart. A "lazy Geolancer" might be mapping a shopping mall or a hawker centre, where POIs are abundant.
To flag these user behaviours, we had to develop an automated solution. We specifically wanted to check all data manually during the beta launch to understand patterns, but automation is necessary for Geolancer to scale.
About the team - heads in the game
Usually, when critical solutions need building fast, there isn’t enough time to include everyone and have long brainstorming conversations. Time was key, as Geolancer was onboarding more and more freelancers each day. The hackathon allowed members from various departments to come together and work on executing the idea, making it a diverse mix.
Torsten came up with the initial concept and coded some of the scripts in Python. He was joined by Sandy, Head of Client Platform at Quadrant, bringing many years of engineering experience to the team; Sai, Quadrant's Data Scientist and Kepler visualisation expert; and Nad, one of our POI Data Consultants.
The process - building the solution
We had already established the idea and need for the solution, so we used the hackathon to do the legwork and prove its value. Having the task clearly laid out is half of the job done.
Step 1: We have a sophisticated dashboard for Geolancer in PowerBI, but for this project we needed raw data. Sandy developed a custom script that made it possible to export arbitrary time scales, geographies, and users from our S3 infrastructure with one command for further processing.
Step 2: We wrote quality check algorithms in Python to discover anomalies in Geolancer movements and behaviour.
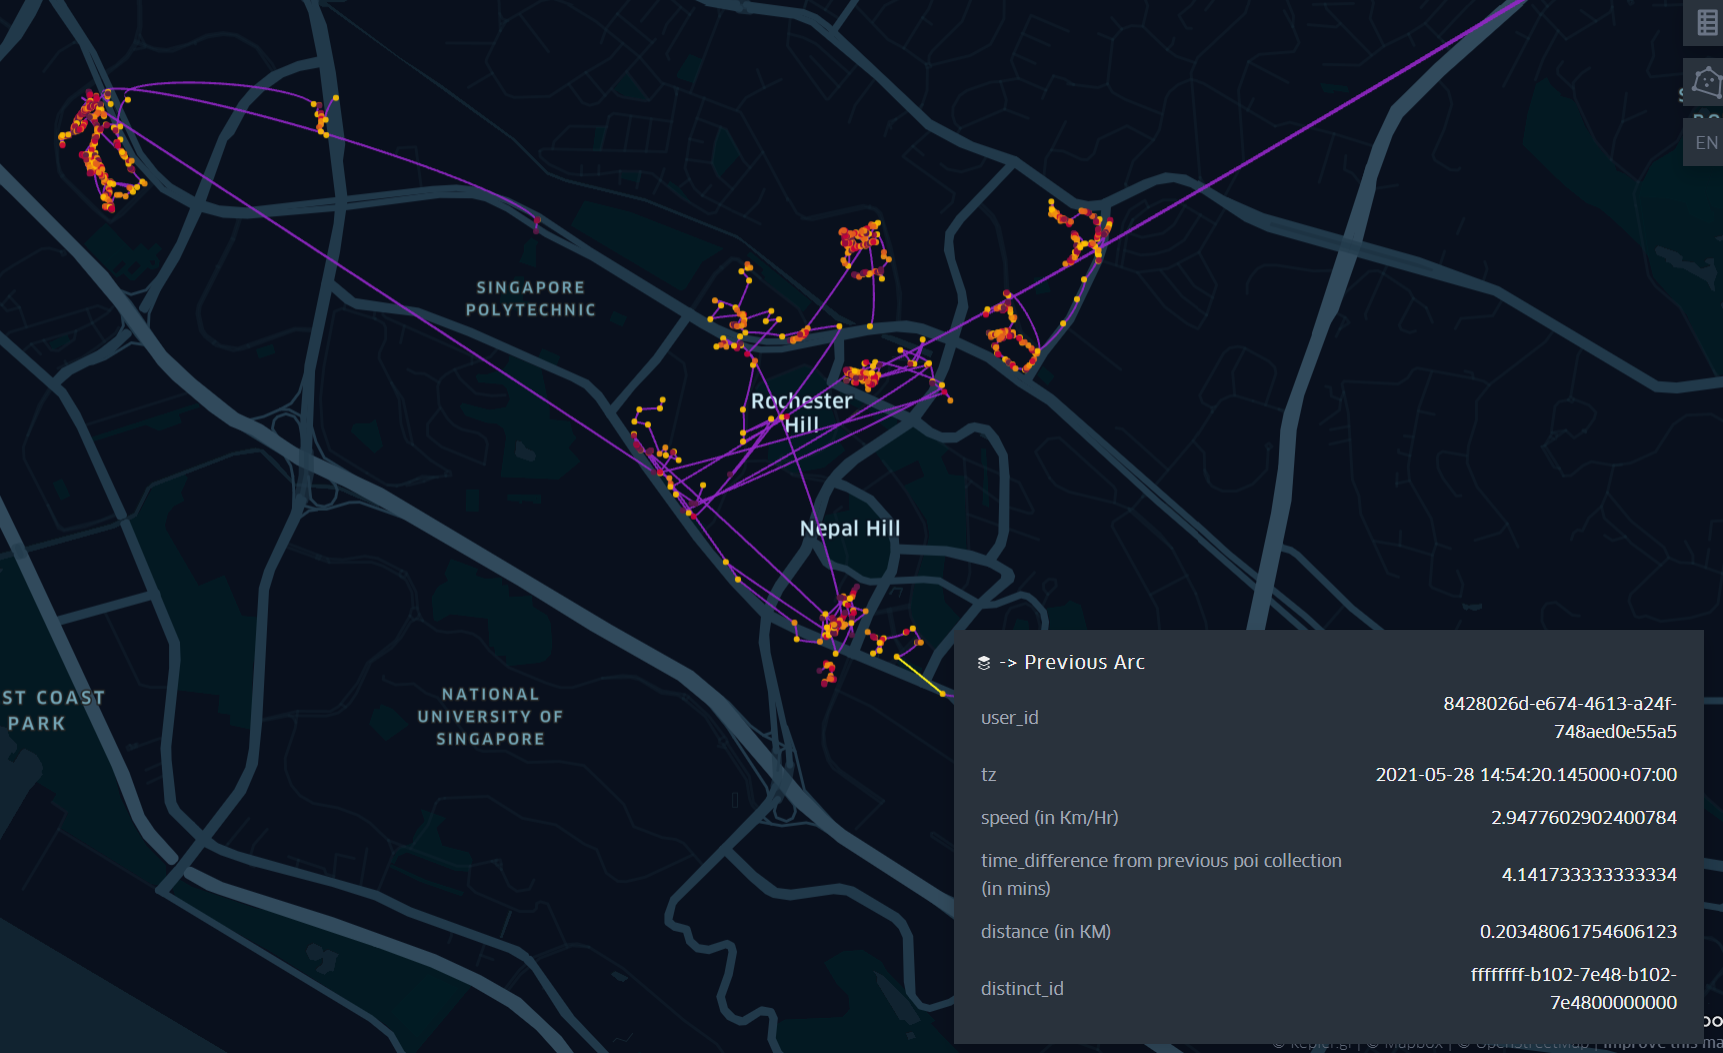
Step 3: We visualised Geolancer journeys using Kepler to catch and further investigate suspicious events.
The results - measuring viability and usage
We now have a birds eye view of important metrics such as seen in the dashboards below.


In the dashboards above we see the most popular times for Geolancers and comparison with the movement patterns of our most successful Geolancer.

In the visualisation above each purple arc represents the movement of a Geolancer. We can see that the Geolancer has traveled 0.2 KM in 4 mins at the speed of 2 km/h, which is realistic.

In this visualisation we see that every place is random and far away. This user even went outside the country of Singapore (which is impossible with current Covid-19 restrictions). This pattern points to GPS spoofing, and after identifying this behaviour we developed custom data cleansing algorithms to exclude these POIs from our commercial datasets and ban these users from Geolancing.

This user enrolled their friends who logged in with the same account and were collecting POIs at same time in different places. The average speed of this user is 1000 km/h which is not possible. While these Geolancers did collect good quality POIs, we decided to tweak our rules around Geolancer accounts to discourage this behaviour.
The benefits - healthy & high-quality POI data
We have been using these tools every day since the hackathon, and even developed them further. They are hugely beneficial for our data partners and buyers as they add an additional quality assurance layer on top of the manually-verified POI records. Moreover, these algorithms help our Geolancers as well. We can set the right expectations, perfect our SOPs, and share useful insights with them about under-mapped areas
Geolancer presents a lot of potential and value for several industries, especially in a Covid-stricken world where a lot of establishments have found themselves displaced in some capacity. Geolancer is putting small businesses back on the map as they recover from the pandemic. The team at Quadrant looks forward to the next quarterly hackathon to come up with new innovations the location data industry desperately needs.